One body.
Too many tabs.
Blood results in a portal. Sleep in an app. A DEXA scan in a PDF. Vedra brings the records you already have into one health atlas, so you can follow changes and ask better questions.
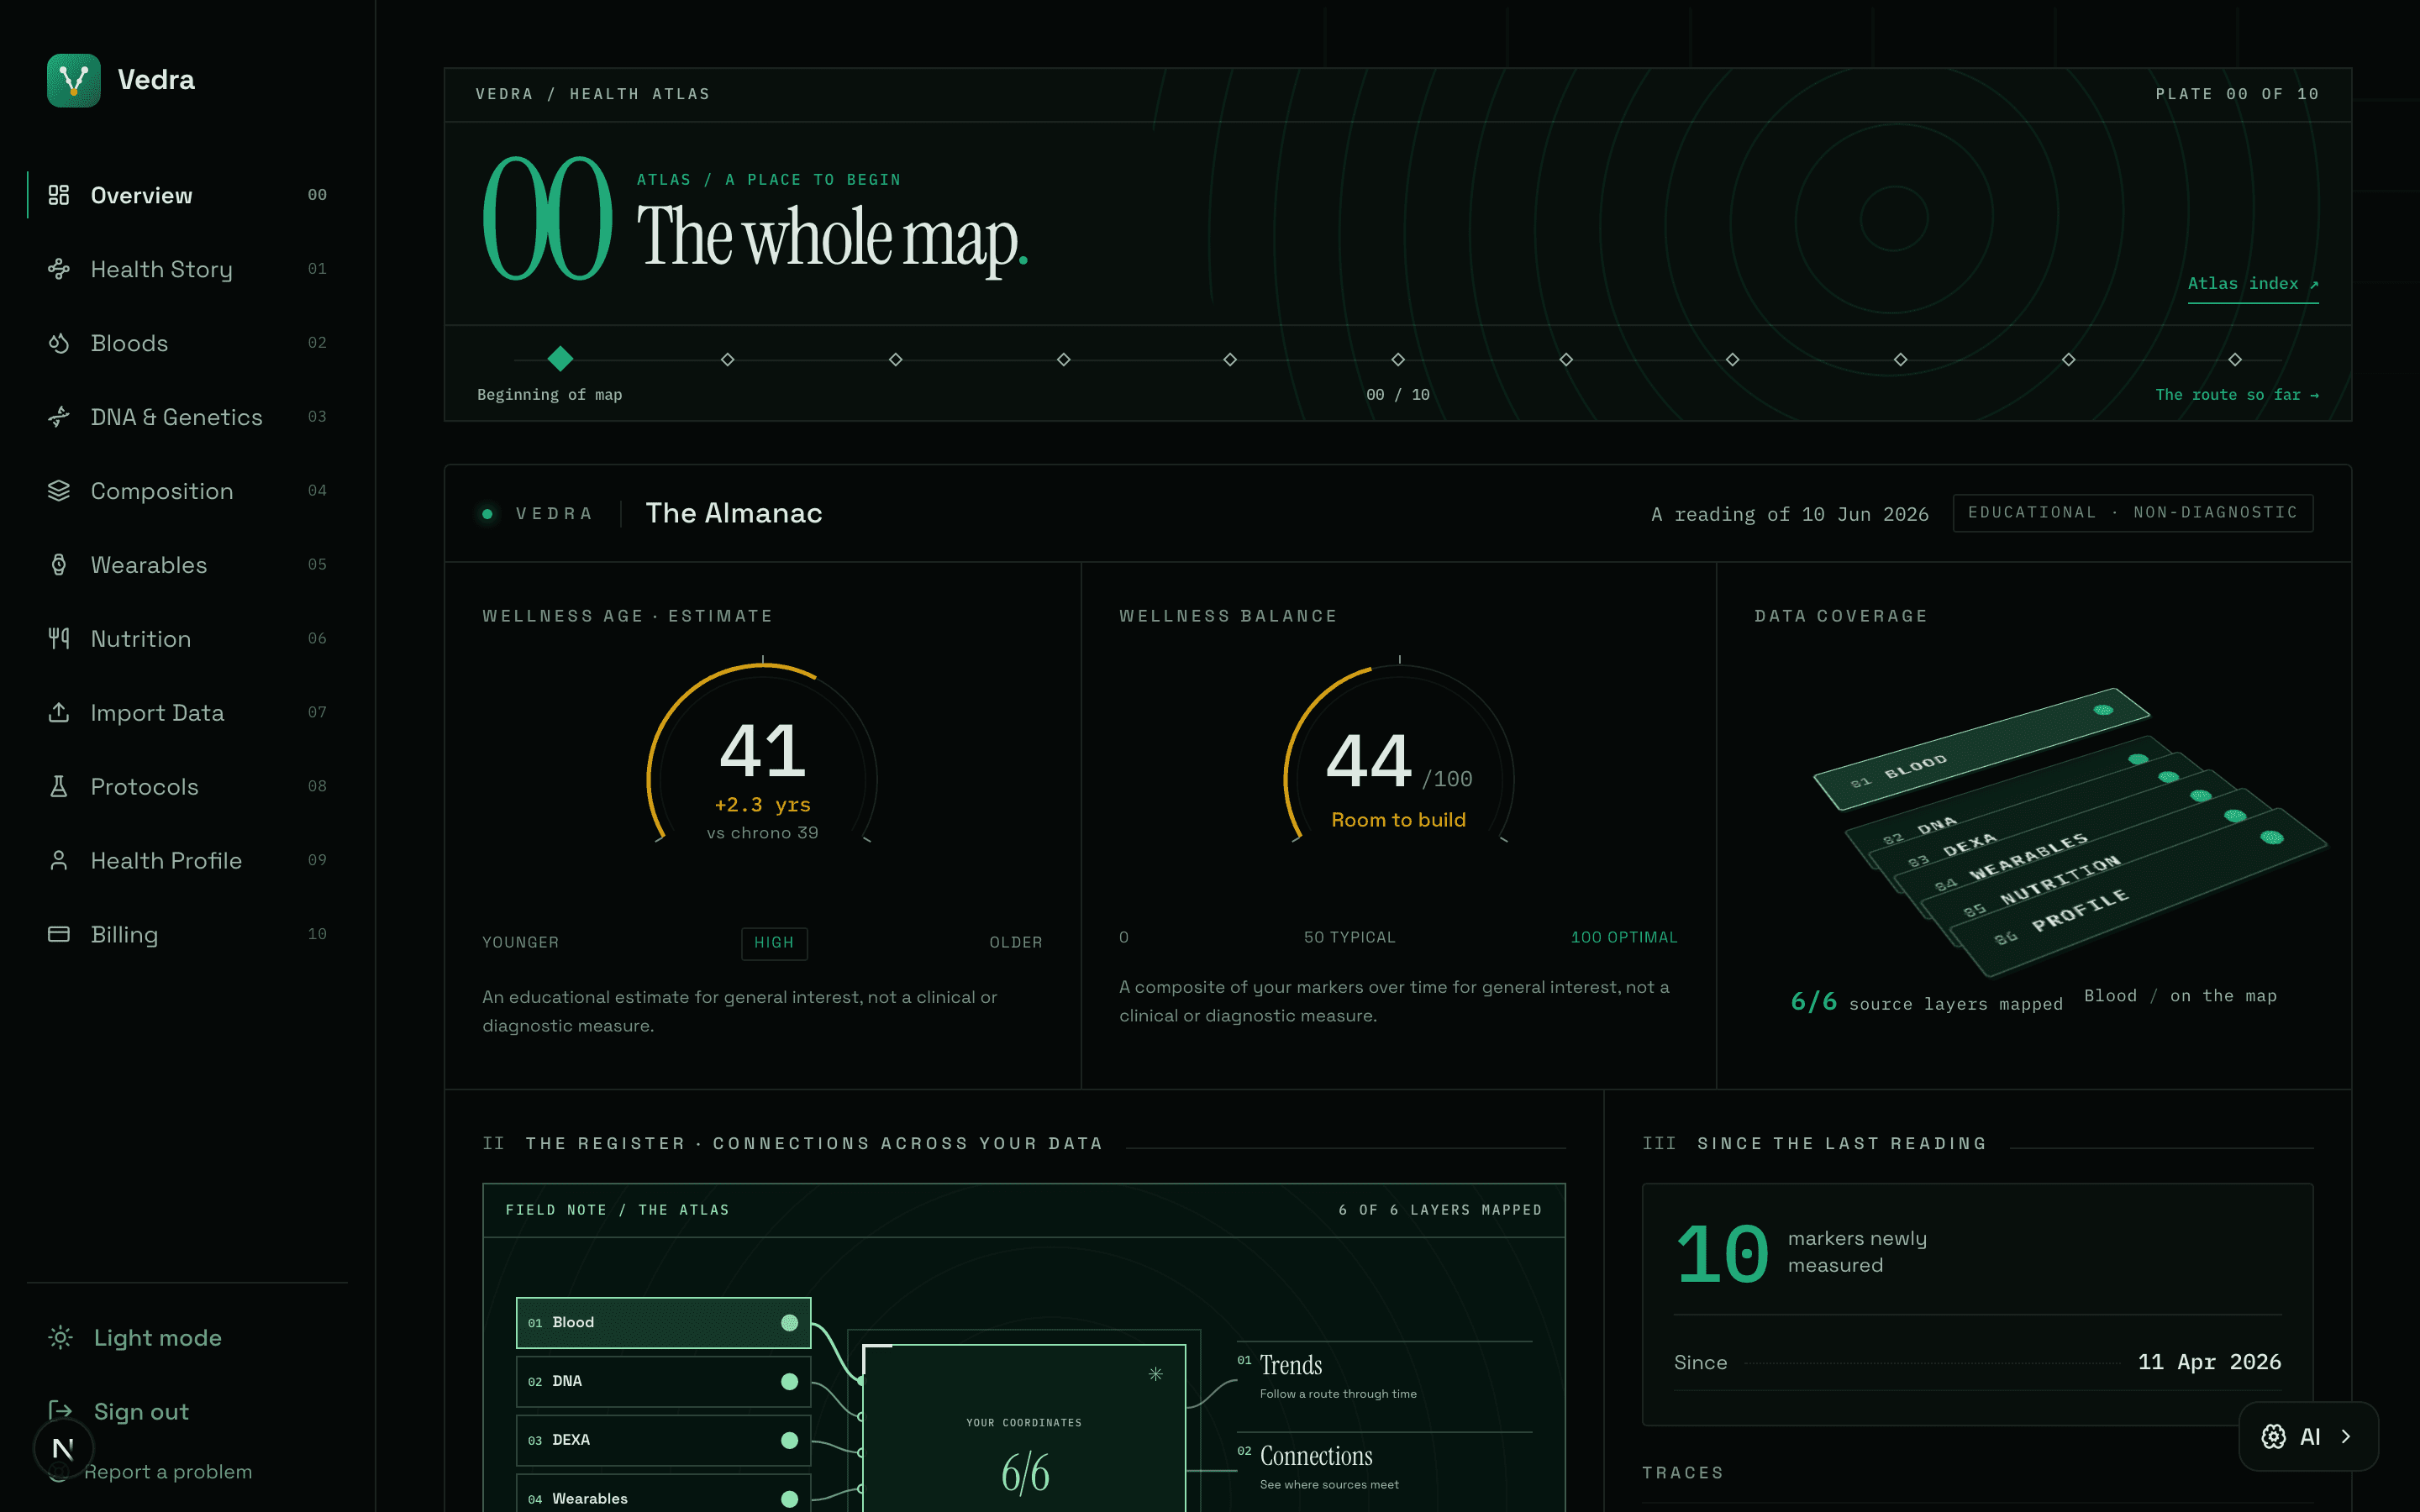
Every source has part of the plot.
Your watch knows Tuesday. A blood test knows a moment. A DEXA scan knows the shape of change. Put their records on one map and see what each can, and cannot, tell you.
BloodA marker is a landmark. Repeat tests show the route it has taken.
Diagram shows how Vedra organises sources. It is illustrative and contains no personal health data.
Start with what you already track.
Pick a starting point. These are real Vedra screens from a demonstration account, with example data, so you can see the job each one does.
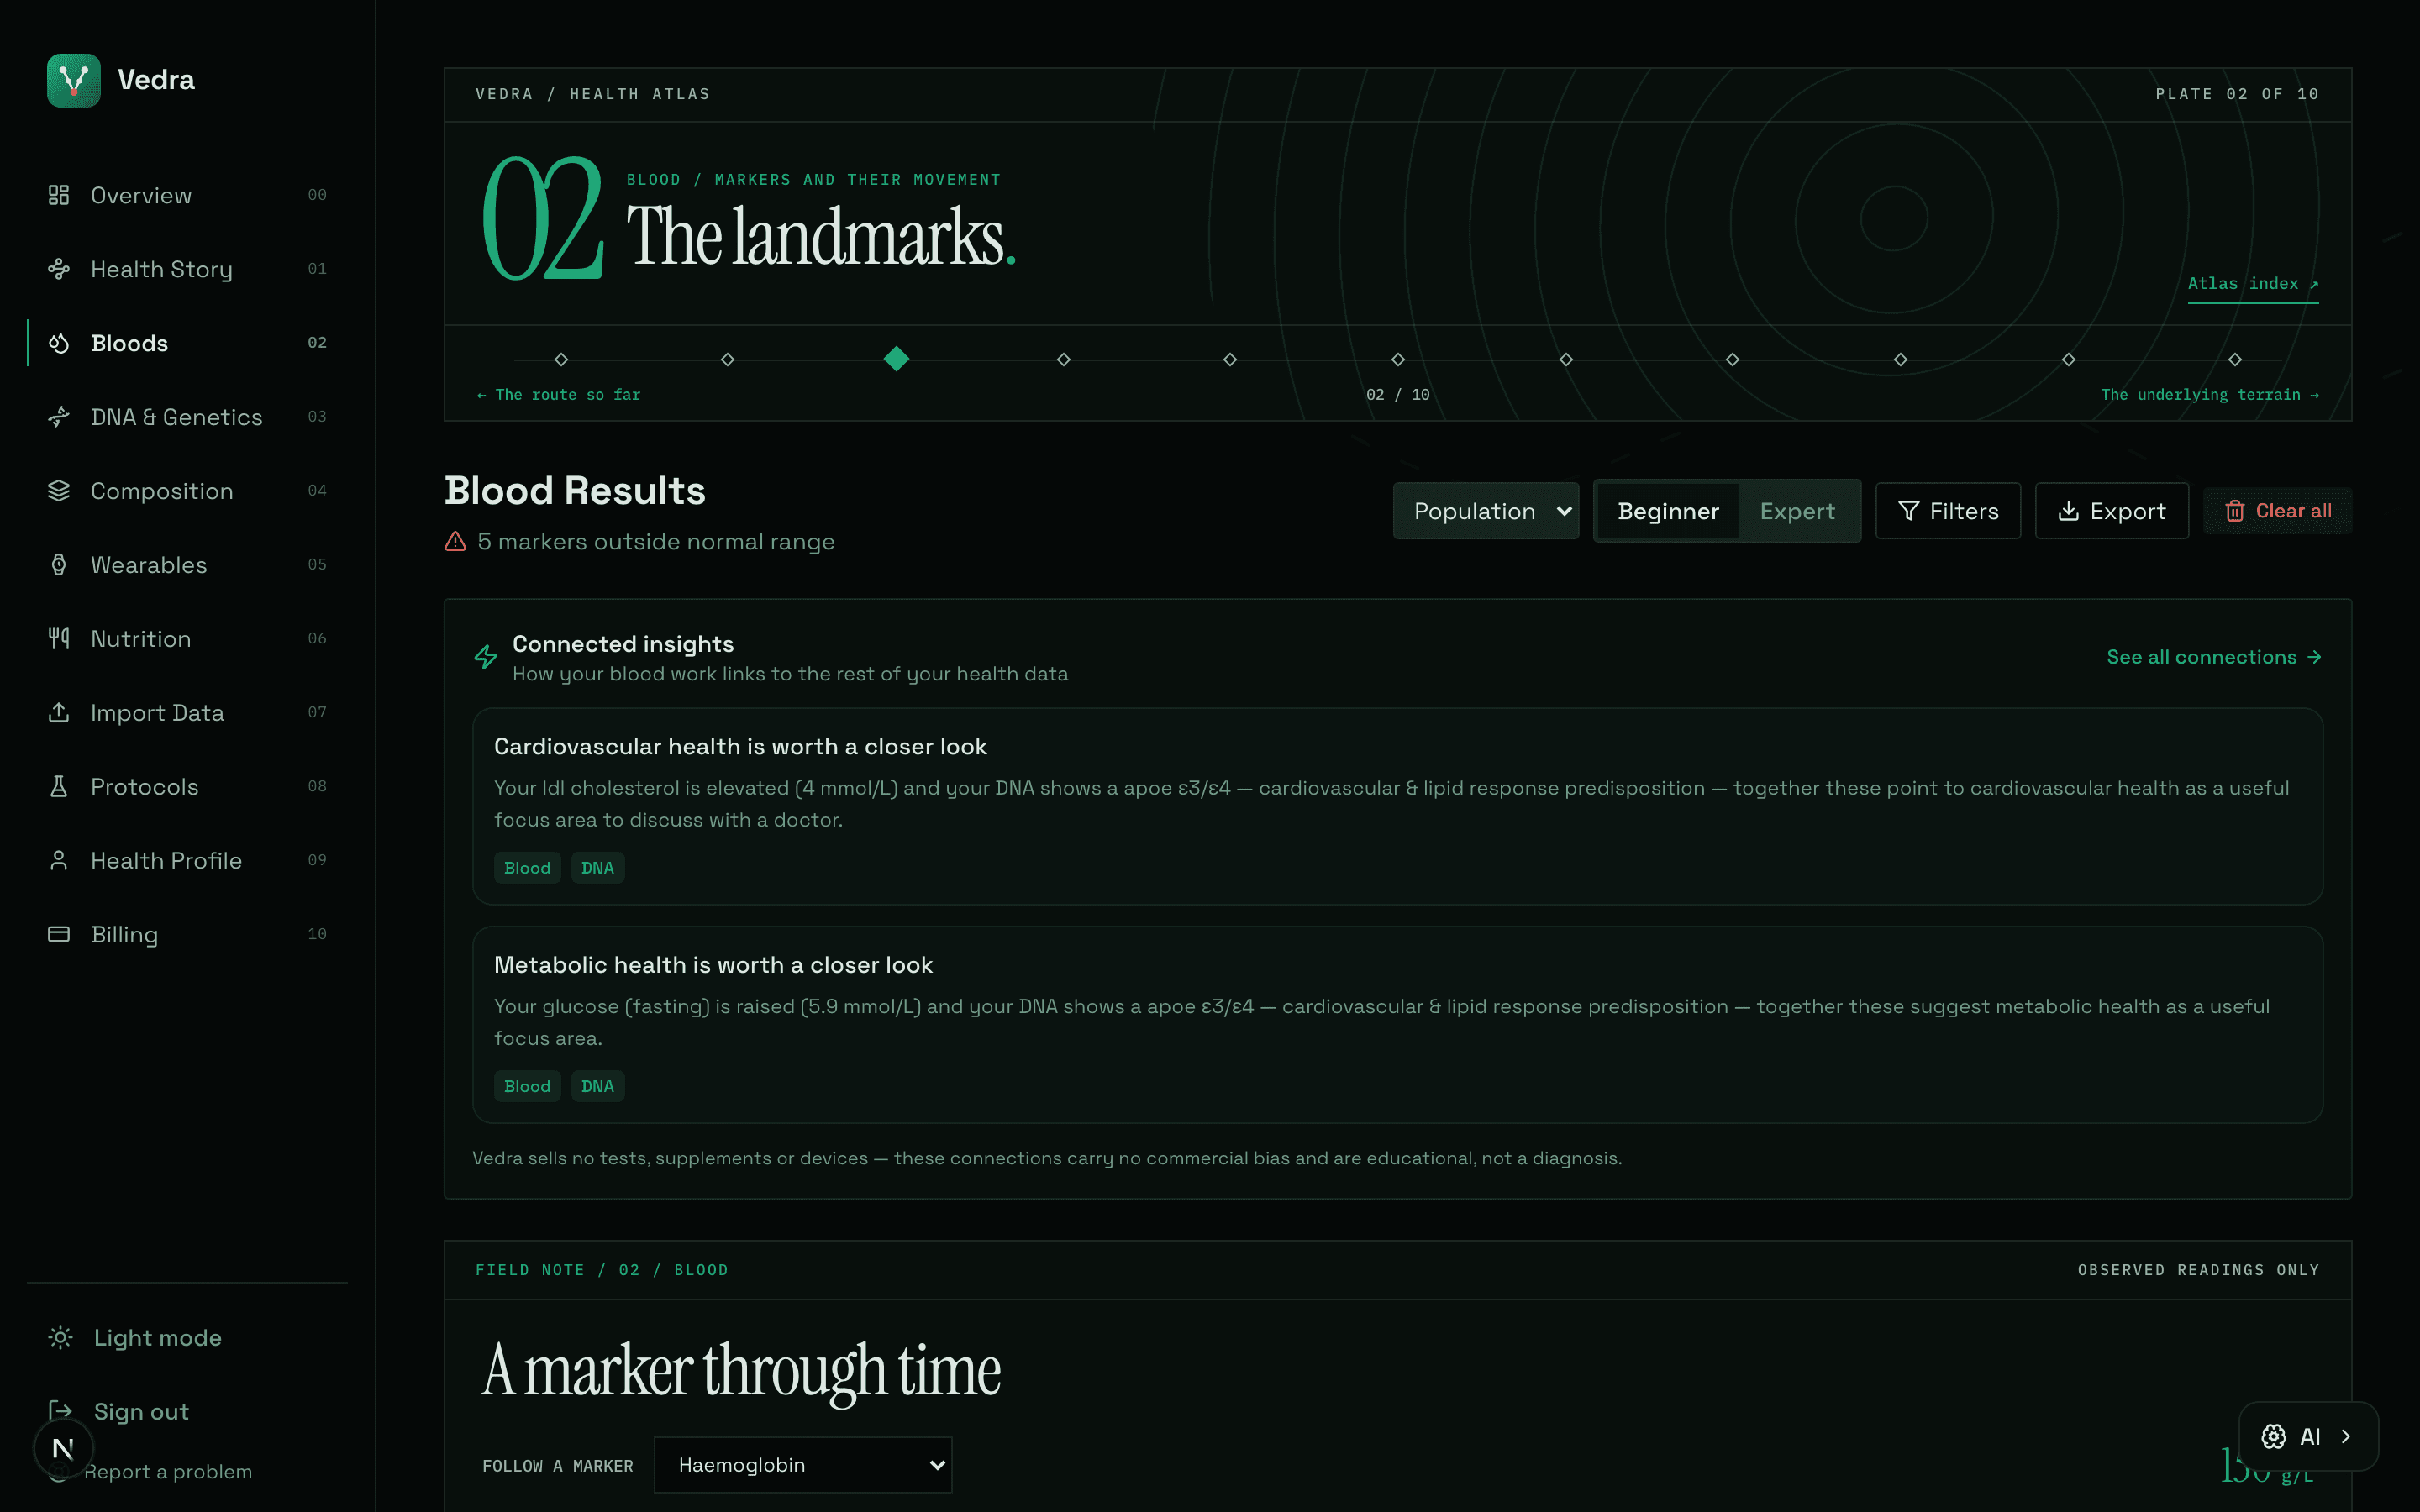
A result is a landmark. The change is the story.
Put results from different dates on the same route. Inspect the measured value, unit and reference range before deciding what deserves a closer look.
Screens show a demonstration account. The readings are examples, not a promise of what your own data will show.
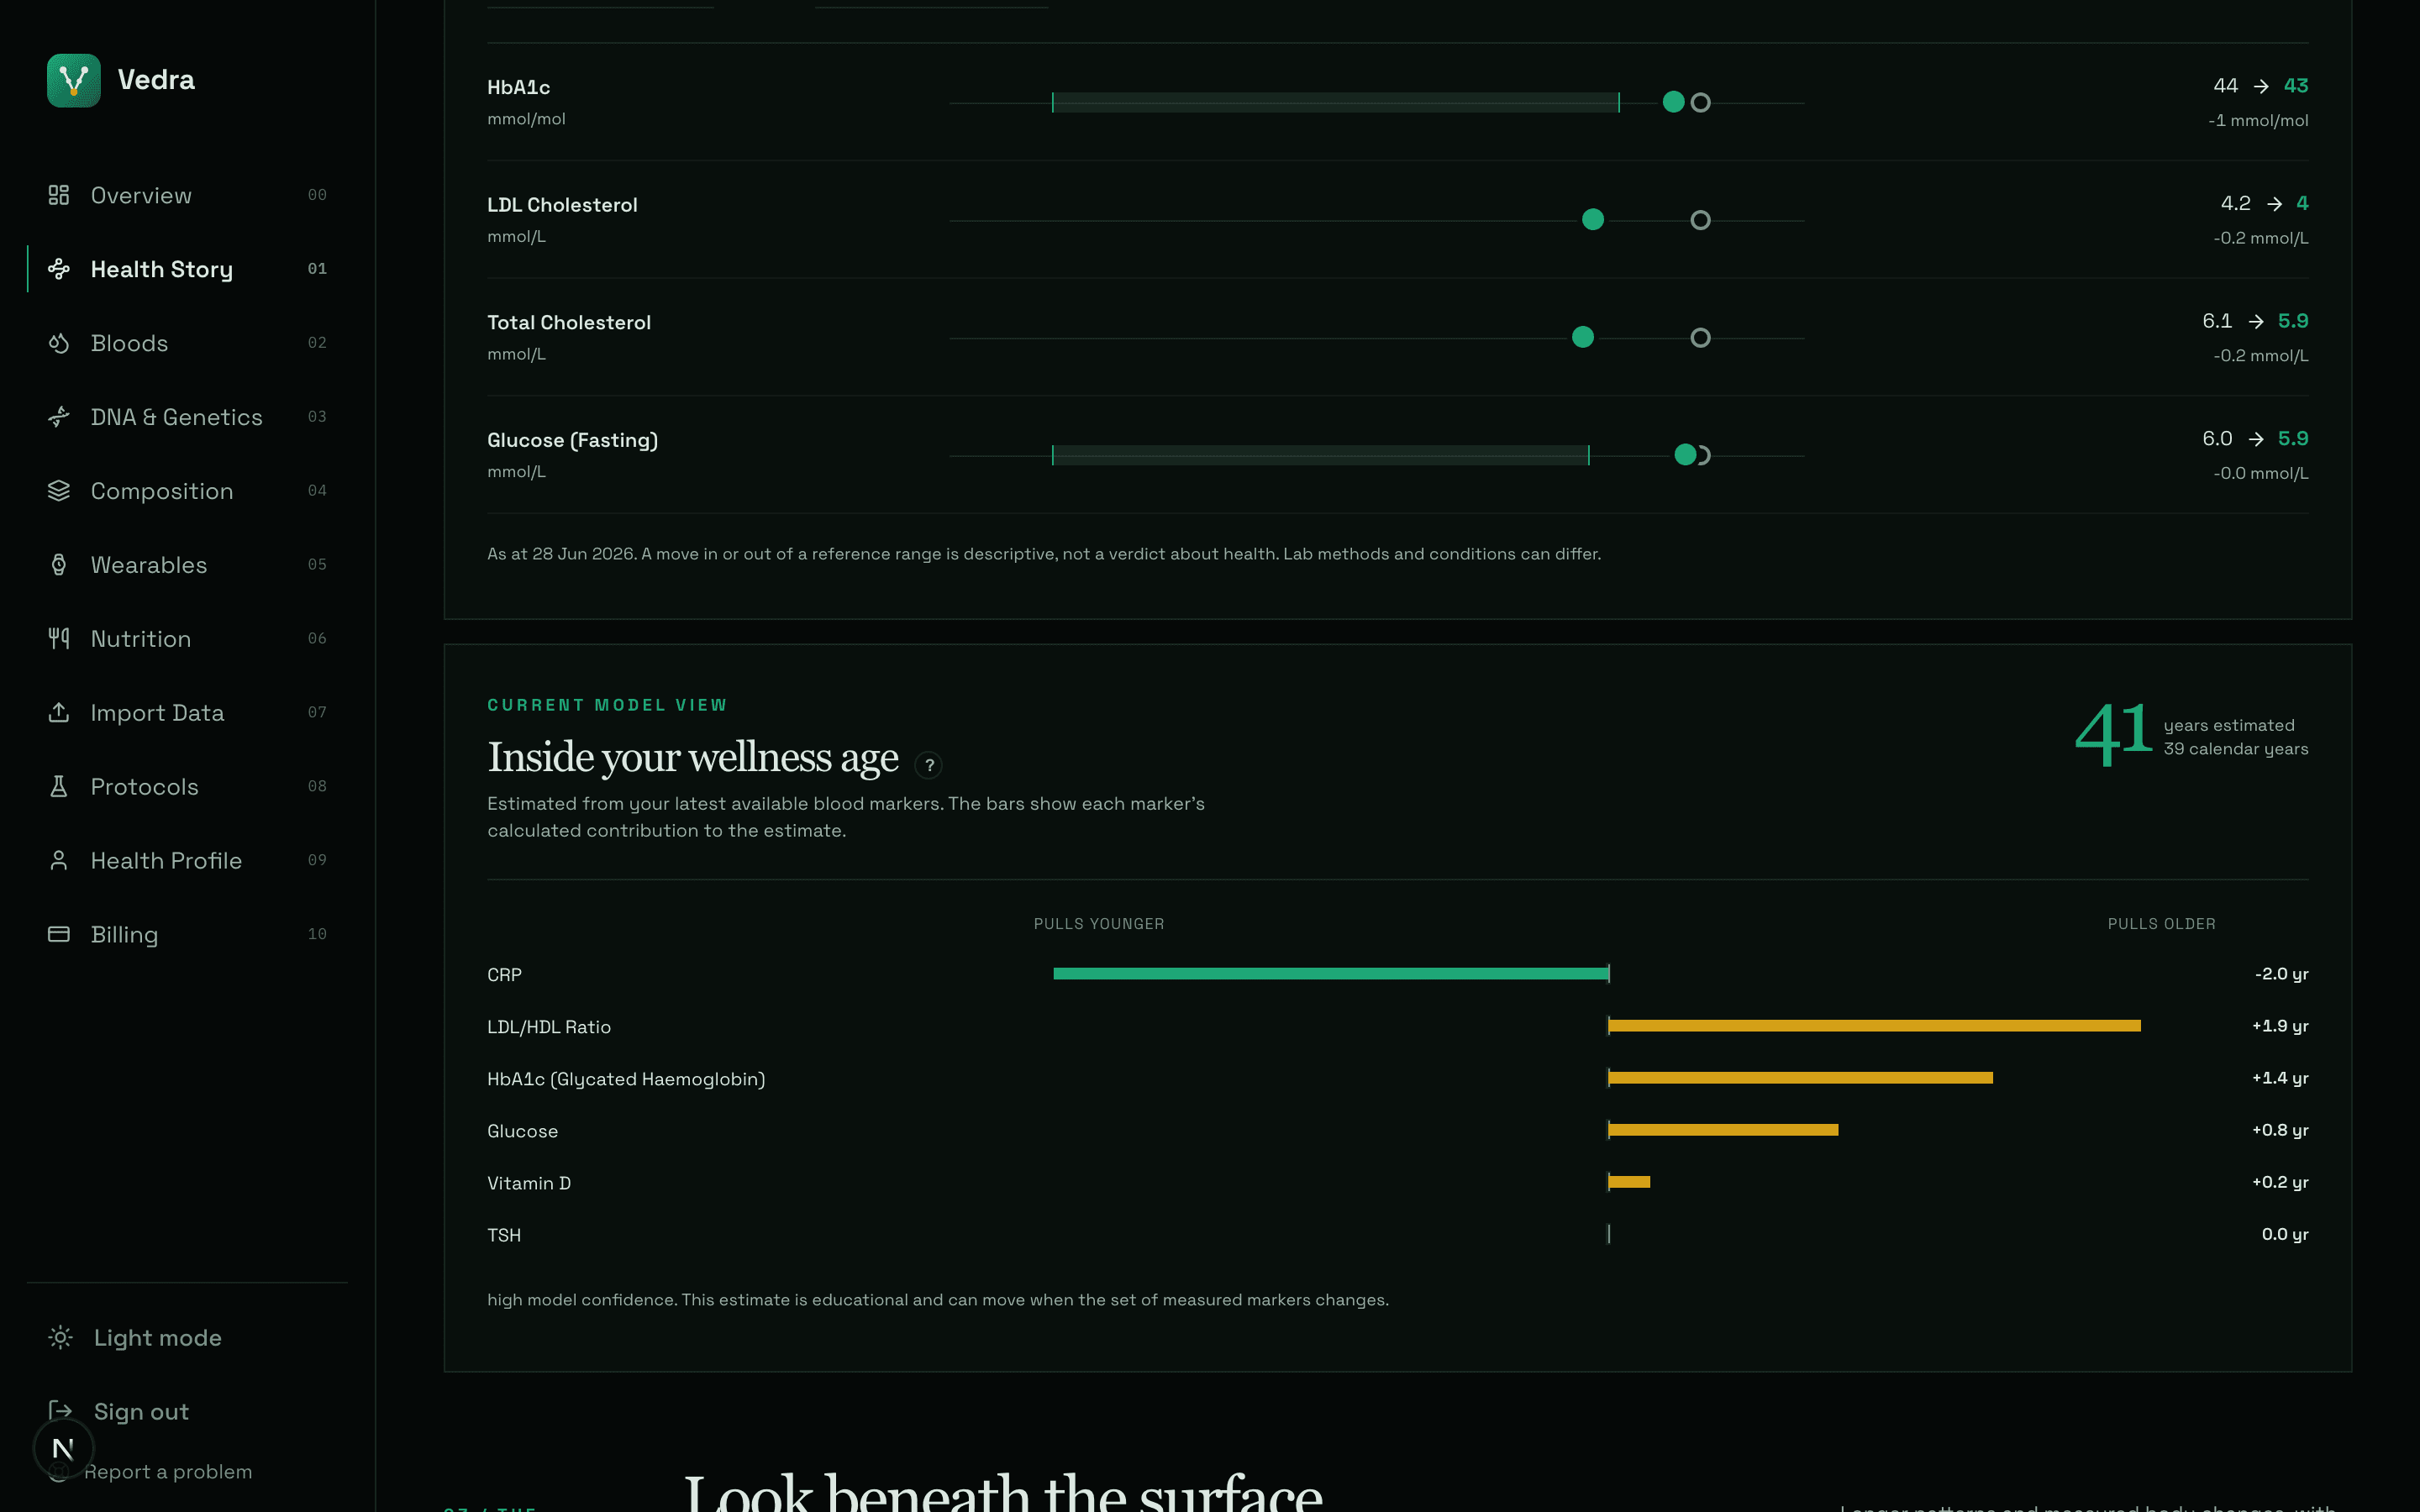
From separate readings to a health story.
The Health Story gathers supported changes and source-backed connections in one reading. It keeps uncertainty visible, including when there is too little data to draw a conclusion.
- Compare recorded changes over time
- See which sources support a connection
- Keep gaps and estimates clearly labelled
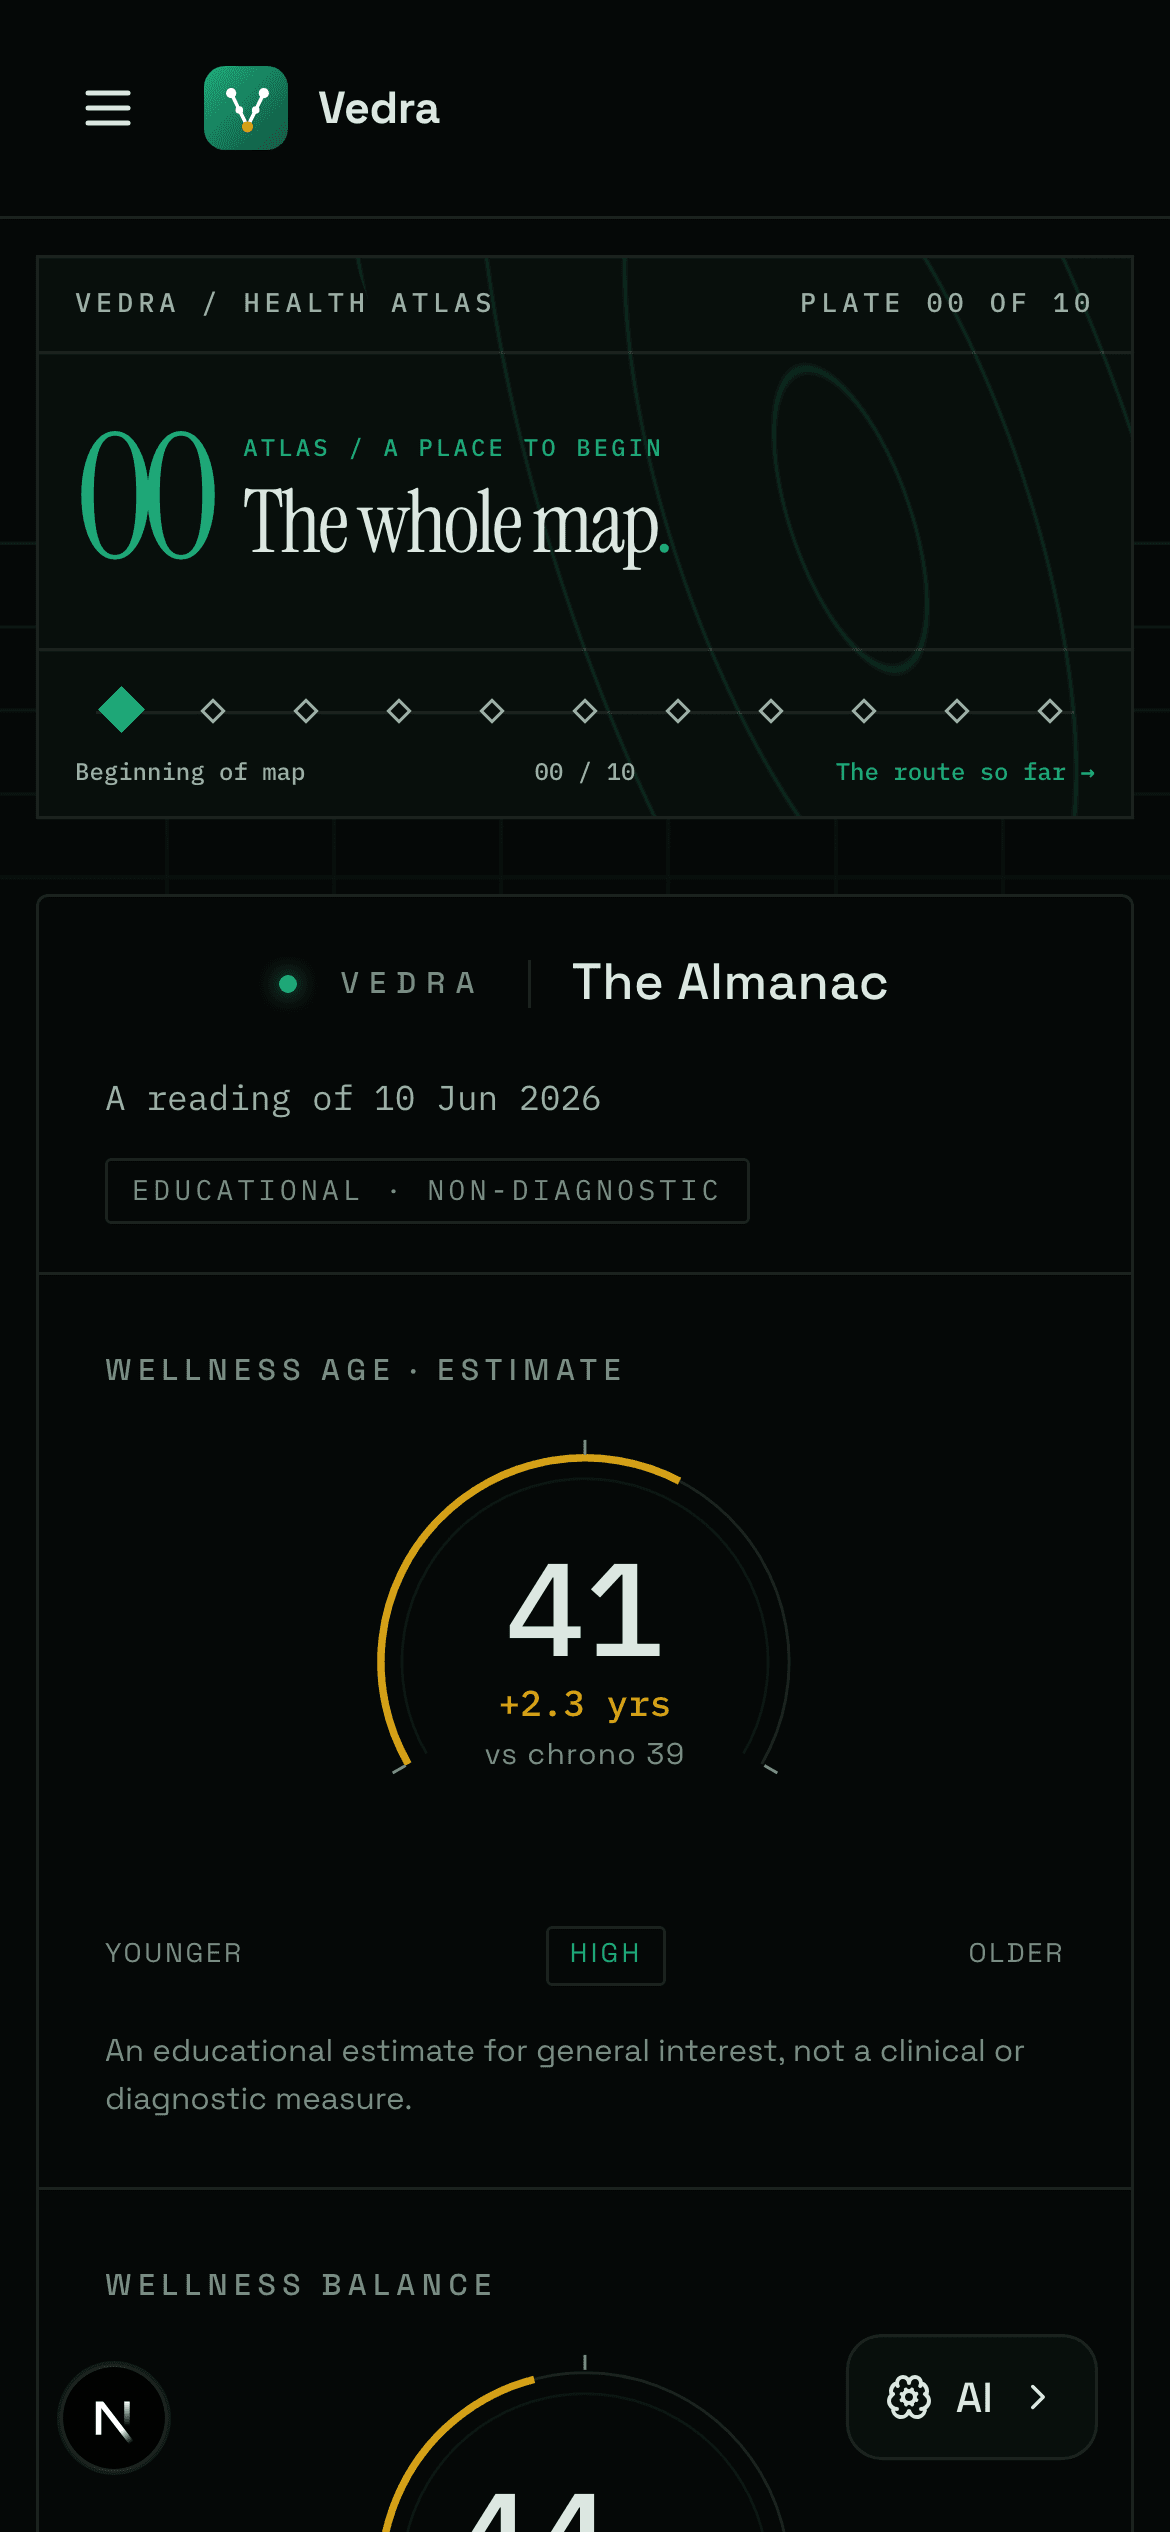
The map fits in your pocket.
Review your readings, add a record and return to the bigger picture from your phone. The mobile view keeps the same dates, units and source labels.
Start with one reading.
See where it leads.
Free to begin. Add more layers as your record grows. Pro is £7.99 a month.
Start mapping for free